Quarry.wmcloud.org
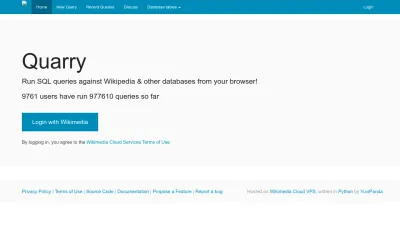
Quarry
Query Wikipedia and related databases using SQL right in your browser. Explore, analyze, and share data easily—no software installation needed.
Query Wikipedia data with SQL in your browser
Quarry lets you write and run SQL queries directly against Wikipedia and other Wikimedia project databases, all from your web browser. Whether you’re curious about article statistics, want to analyze editing patterns, or need specific data for research, you can get started quickly without setting up any software.
It’s designed for anyone interested in exploring Wikimedia data—from researchers and developers to curious editors. You can view, edit, and share your queries, browse recent ones for inspiration, and access detailed documentation to help you along the way.
With simple login using your Wikimedia account, Quarry makes it easy to dig into the vast world of Wikipedia data. It’s a handy tool for collaborative research, data analysis, or just satisfying your curiosity about how Wikimedia projects work under the hood.
 Alternatives to Quarry.wmcloud.org
Discover websites similar to Quarry.wmcloud.org based on shared categories, topics, and features.
Alternatives with .org Domain Extension
BioCyc offers integrated genome and metabolic pathway data for thousands of organisms, plus bioinformatics tools for research and analysis.
Voyant Tools is a web-based platform for analyzing and visualizing texts, making it easy to explore word patterns and trends in documents.
lobid.org offers open data tools and APIs for libraries, letting you search, access, and connect library resources and information easily.
Create custom data visualizations in JavaScript with D3. Flexible tools for interactive charts and graphics, perfect for developers and data storytellers.
Explore interactive visuals to analyze global health data, track disease trends, and compare risk factors across countries and time periods.
Access, analyze, and visualize global development data with interactive charts, tables, and maps from the World Bank's extensive databases.
Gephi is a free, open-source platform to visualize and explore graphs and network data, making complex connections easy to see and understand.
The HDF Group offers tools, libraries, and support for managing, sharing, and preserving scientific and engineering data across platforms and environments.
Create elegant data visualizations in R using ggplot2, a flexible system based on the Grammar of Graphics for mapping data to visual elements.
Movebank lets you explore, manage, and share animal tracking data for research and collaboration in wildlife movement and ecology studies worldwide.
CodaLab Worksheets lets you run, share, and reproduce data experiments and research code online, making collaboration and transparency simple.
Explore and visualize high-dimensional data or machine learning embeddings interactively in your browser with TensorFlow’s easy-to-use projector tool.
OPeNDAP offers free, open-source tools to help researchers and data providers access, share, and manage distributed scientific datasets easily.
CAS offers scientific research platforms and data solutions to help researchers accelerate discoveries, manage information, and drive innovation across fields.
Sage Bionetworks helps researchers share, analyze, and reuse biomedical data, accelerating scientific discovery with AI-powered tools and a collaborative platform.
Explore UK public research projects, publications, and funding with Gateway to Research—an easy way to find people, outcomes, and organizations in science.
Explore and search biomedical ontologies with Ontobee, a platform for browsing, visualizing, and integrating linked ontology data for research and study.
Explore evolutionary gene relationships across genomes with OMA, offering orthology predictions, data downloads, and analysis tools for researchers.
OpenRefine lets you clean, transform, and organize messy data for free. Easily format, enrich, and prepare datasets using this open source tool.
Tidyverse offers a collection of R packages for data science, making data analysis, visualization, and manipulation in R simpler and more consistent.
More Quarry.wmcloud.org Alternatives
Altmetric lets you track and visualize online attention to published research, helping you see the impact and reach of your work across the web.
Search patents and analyze intellectual property with a free online database offering powerful research tools and data analytics for innovations worldwide.
Explore interactive data visualizations and visual explanations that make complex topics easy to understand for learners and curious minds.
Access and explore wildlife, habitat, and fisheries data from the California Department of Fish and Wildlife in one easy-to-use online portal.
Explore and create interactive data visualizations in Python with Vega-Altair's easy-to-use, declarative charting library and helpful documentation.
Open-source software for statistical analysis, econometrics, and time-series modeling. Free, multi-language support for data analysis and research.
Chartio is a cloud-based analytics platform that lets anyone explore, visualize, and understand business data—no technical skills required.
Mode is a data analysis platform that lets you explore, visualize, and share business insights easily. Sign in to access powerful analytics tools.
Explore scientific research with Dimensions AI—find grants, publications, datasets, clinical trials, patents, and policy documents all in one place.
Discover, publish, and share quality datasets with DataHub. Access thousands of free and premium data resources, updated and ready for your projects.
Circana offers data tools and expert analysis to help businesses understand consumer trends, track industry data, and make informed decisions for growth.
Webz.io provides structured data and insights from the open, deep, and dark web to help you monitor risks, track trends, and make informed decisions.
CoreFiling offers intelligent software and services for digital data collection, XBRL reporting, and ESG compliance for businesses and auditors.
Tableau helps you explore and visualize your data, connect to many sources, and share insights easily for faster, smarter business decisions.
AgriMetSoft offers easy-to-use software for climate, agriculture, and meteorology data analysis, helping researchers and scientists study environmental changes.
Mixpanel lets you track and analyze user behavior in real time, helping teams make smarter decisions with easy-to-use digital analytics tools.
Access business data and analytics to help you make smarter sales, marketing, and risk decisions with Dun & Bradstreet's trusted platform.
Power BI lets you connect, visualize, and share data insights easily, helping you make informed decisions with interactive dashboards and reports.
Get daily satellite imagery and earth analytics to monitor changes, make informed decisions, and gain a multidimensional view of our changing planet.
Access seismic data, tools, and resources for earth science research and education through this collaborative seismology and geoscience platform.